Use Case 2 – Telecommunications
The usage of mobile phones and the resulting datasets stored in Call Detail Records (CDR) represent a high quality proxy to better understand human mobility behavior in different application scenarios such as smart cities, transportation planning and environmental monitoring.
Analytic Goals
Mobile phones communicate to antennas covering specific local areas. The active connection between a phone and an antenna, e.g. a phone call or a text message, represents spatio-temporal information that, once collected and aggregated, reflects the distribution of users in an area covered by mobile services. The analytic goals of ASAP focused on better understanding such aggregated data – applying strict data anonymization procedures and addressing the involved computational challenges.
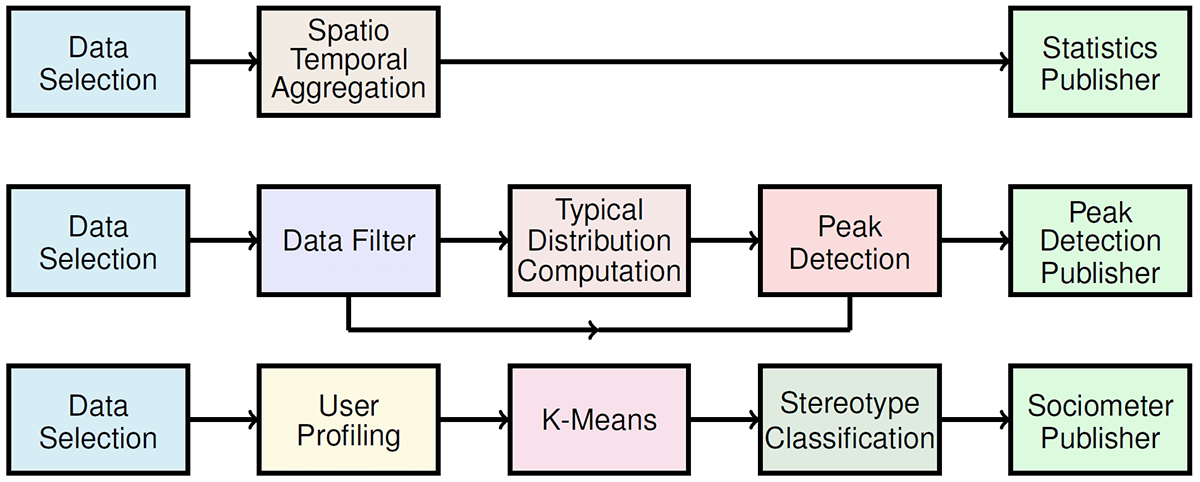
Within ASAP, a telecommunications application was designed to demonstrate how analytical services based on human mobility data can be provided during routine mobile network operation. The following diagram shows the workflow of selected modules of this application, including user profiling, sociometer and peak detection.
Applications
The sheer volume of CDR data poses computational challenges when collecting, storing, mining, and visualizing specific indicators. In this context, ASAP investigated the following applications:
- Event Detection analyses the different features of an event, including its spatio-temporal characteristics, social aspects, and statistical properties. By controlling input parameters such as time interval, spatial area and additional CRM attributes, analysts gain a detailed understanding of evolving events.
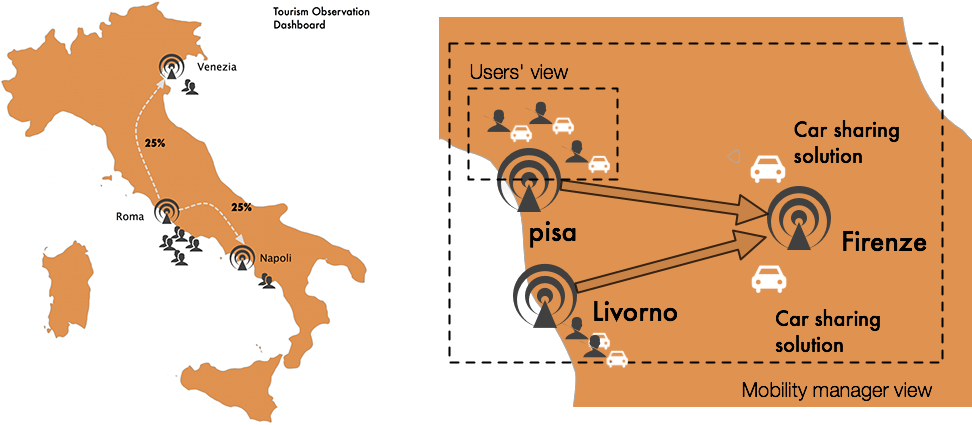
- Ridesharing provides functions for mobility managers and individual drivers alike, e.g. the visualization of routine trips in a specific area, together with an optimized car sharing solution for managing such trips. A driver can use this application as a recommender system to identify ridesharing opportunities.
- Tourism Observation. The analysis of dynamic tourist flows allows mobility managers to identify common movement patterns of visitors, using a map-based dashboard to provide spatio-temporal constraints as input. Along this line, mobile phone data, despite their limited spatial precision compared to other location data such as GPS, are of interest due to their global availability across countries, and their independence from specific means of transportation. We can use this kind of data to reconstruct mobility and traffic flows by using origin / destination matrices, complemented by other sources such as CDR-based traffic intensity, traffic migration from handovers, and individual movements of volunteer participants.
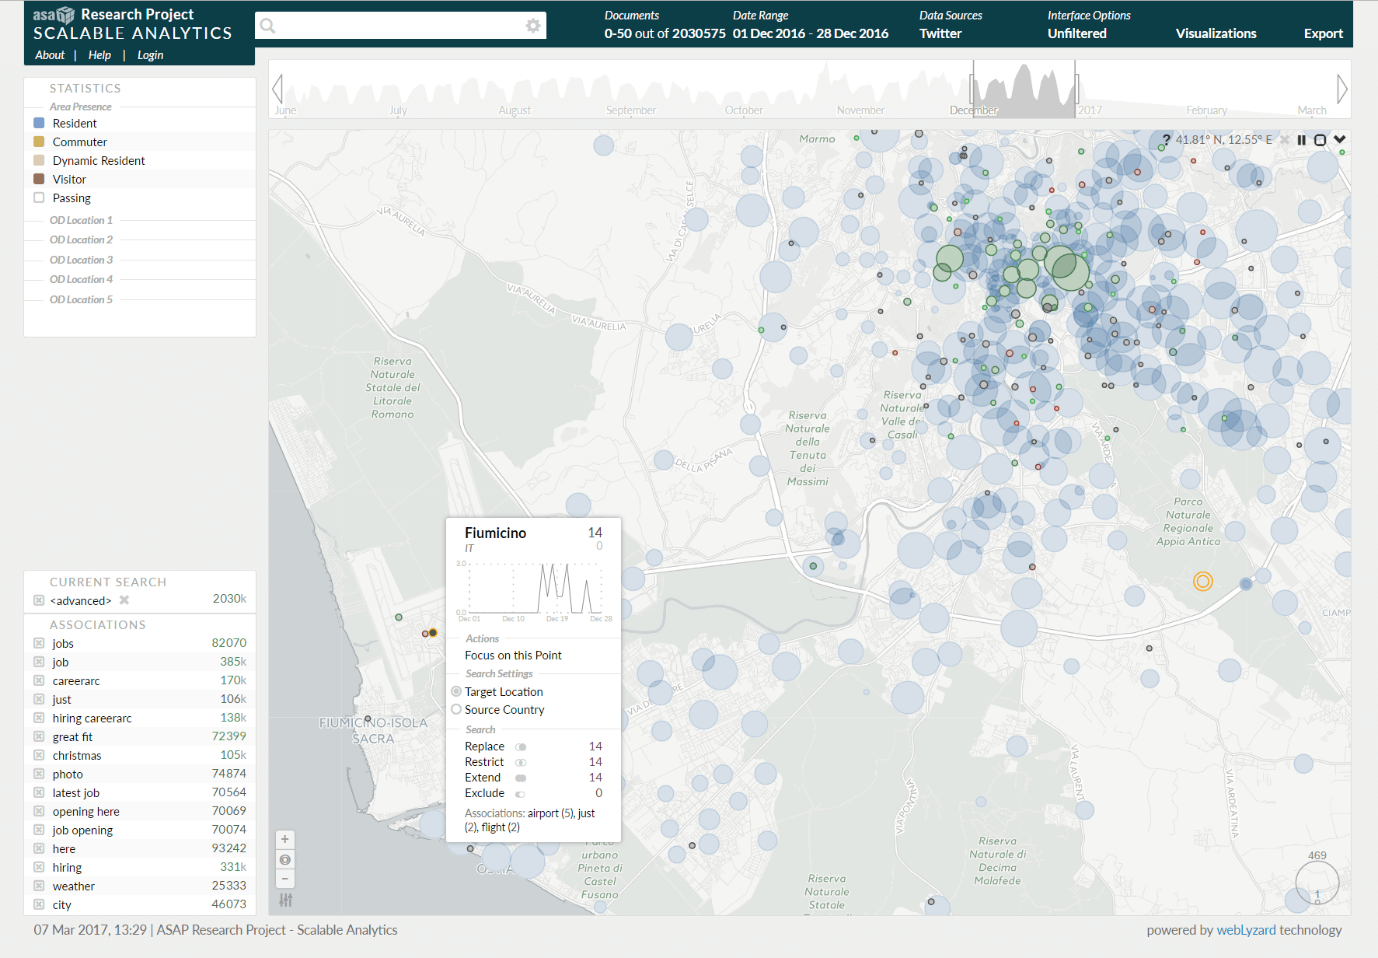
Interactive Exploration
The ASAP dashboard illustrates how actionable knowledge can be visualized from the ingested statistical indicators – to understand weekly patterns of user movement, for example, or visualize the interplay of multiple indicators by generating an overlay of social media content on top of aggregated CDR data.
To index and visualize the statistical data produced by the ASAP workflow – e.g. area presence by user type (resident, dynamic resident, commuter, visitor or passerby), origin / destination matrices, etc. – a Statistical Data API was developed following the RDF Data Cube Vocabulary approach. It supports JSON to enable rapid visualization of large datasets. The desired slices of a particular dataset, e.g. the residents who visit a certain area, do not need to be defined within the dataset, but can be specified at runtime.
Tested with queries that delivered up to 100 million documents, the geographic map of the webLyzard Web intelligence platform has been optimized for large datasets. The figure below shows the maximized version of the map including a tooltip for on-the-fly query refinements. Users can zoom to street level and visualize anonymized cell tower activity data from the City of Rome (blue markers), and overlay this information with geotagged Twitter postings (green = positive sentiment; red = negative sentiment) – e.g., to identify communication hotspots during an event. The examples are intended as a proof of concept how semantic technologies in conjunction with advanced visual tools can transform statistical data into valuable repositories of actionable knowledge.